Sensory neurons in the mouse eye and nose have unusual chromatin organization. Here we report their three-dimensional (3D)
genome structure at 20-kilobase (kb) resolution, achieved by applying our recently developed diploid chromatin conformation
capture (Dip-C) method to 409 single cells from the retina and the main olfactory epithelium (MOE) of adult and newborn mice (Figure 1).

Fig. 1.
Schematic of the experiment. We performed Dip-C on 409 single cells isolated from the retina and the MOE of adult and newborn mice.
3D genome of rod photoreceptors exhibited inverted radial distribution of euchromatin and heterochromatin compared with
that of other cell types (Figure 2). Adult rods (from 8-week-old mice) exhibited a concentric topology with the CpG-rich
euchromatin (green) in the outermost shell, and the CpG-poor heterochromatin
(magenta) near the center. In contrast, the nuclear
periphery of retinal precursors (from 1-week-old mice) was occupied by the CpG-poor heterochromatin, similar to
normal cells.

Fig. 2.
Representative 3D genome structures of adult rods (top), young adult rods (middle), and retinal precursors (bottom). We found developmental radial inversion of euchromatin (green) and heterochromatin (magenta) across the genome.
Unlike rods, the nuclear periphery of OSNs was
still occupied by the CpG-poor heterochromatin (Figure 3). Despite this overall normal configuration, we found
genomic loci that harbor the ~1,000 olfactory receptor (OR) genes—typically low in CpG frequency—
to deviate from their normal positions. In OSNs, these loci were heavily biased towards the interior, and in many cases resided near putative chromocenters.

Fig. 3.
Representative 3D genome structures of mature OSNs (top) and non-neuronal cells (bottom) in the main olfactory epithelium (MOE), with olfactory receptor (OR) genes highlighted in color. OSNs are not overall "inside-out"; however, they bias the OR genes towards the nuclear interior.
Finally, we approach the critical question: how
many of the ~1,000 ORs and their ~60 enhancers are interacting in each OSN? Moreover, is
there a single, large aggregate of enhancers per cell, which could be
responsible for determining the one chosen OR?
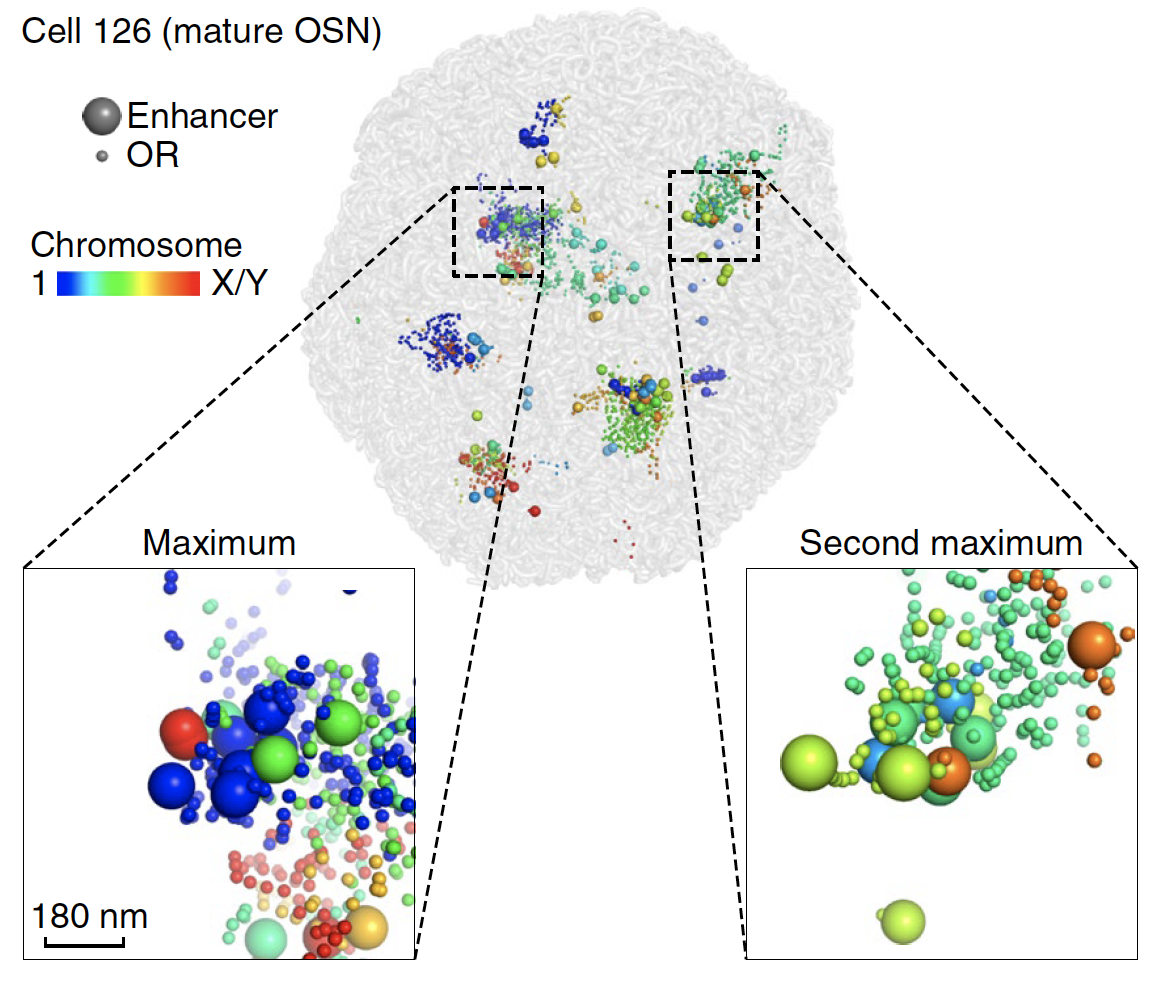
In each OSN,
we found both ORs and their enhancers to be a mixture of highly
intermingled aggregates from multiple chromosomes, and weakly
interacting or isolated spots (Figure 4). Such aggregation
is highly cell-type-specific, because in non-neuronal MOE cells,
ORs (or enhancers) from different chromosomes rarely interacted.
We found olfactory enhancers to form multiple small aggregates
per OSN. In the most dense enhancer aggregate—presumably
the site of stable OR transcription—each OR
had access to an average of 7 enhancers from 4 chromosomes within 150 nm (or 19 enhancers from
8 chromosomes within 600 nm).

Fig. 4.
3D aggregation of OR genes and their enhancers in a representative mature OSN. Each OSN harbors multiple aggregates (boxed) of OR enhancers from different chromosomes.
We also observed structural heterogeneity of the protocadherin gene cluster, for which no
imaging data are currently available, and identified their specific interaction partners from other chromosomes.
Physical interactions between different chromosomes have long been
believed to regulate cellular functions. However, interchromosomal
contacts are especially challenging for traditional methods. Our Dip-C method fills in this long-standing
methodological gap. Our structural characterization of the 3D
genomes of rods and OSNs highlights a central theme that interchromosomal
contacts, probably mediated by DNA–protein and
protein–protein interactions, are associated with important
neuronal functions.
References:
Tan, Longzhi; Xing, Dong; Daley, Nicholas; Xie, X. Sunney "Three-dimensional genome structures of single sensory neurons in mouse visual and olfactory systems," Nat Struct Mol Biol 26(4) 297-307. DOI:10.1038/s41594-019-0205-2 (2019)
| 
