Quantifying E. coli Proteome and Transcriptome with Single-Molecule Sensitivity in Single Cells
Gene expression is often stochastic, because gene regulation takes place at a single DNA locus within a cell. Thus, protein and messenger RNA (mRNA) copy numbers vary from cell to cell in isogenic bacterial populations. However, these molecules often exist in low copy numbers and are difficult to detect in single cells, making single molecule detection important.

Figure 1: (A) A poly(dimethylsiloxane) (PDMS) microfluidic chip is used for imaging 96 library strains. E. coli cells of each strain are injected into separate lanes and immobilized on a polylysine-coated coverslip for automated fluorescence imaging with single-molecule sensitivity. (B) A representative fluorescence image overlaid on phase-contrast image of a library strain, in which Adk is tagged with YFP, with respective single-cell–protein level histogram that are fit to gamma distributions with parameters a and b. The cytoplasmic protein Adk is uniformly distributed intracellularly.
To profile global variation at all expression levels, we constructed an E. coli yellow fluorescent protein (YFP) fusion library that includes more than 1,000 genes (1). To facilitate high throughput analyses of the YFP library strains, we implemented an automated imaging platform based on a microfluidic device that holds 96 independent library strains attached to a polylysine-coated coverslip (Figure 1A). Imaging was performed with a single-molecule fluorescence microscope. The 1000 genes had expression levels ranging from 0.1 to 10,000 proteins per cell. About 50% of the proteins are expressed at an average level of fewer than ten molecules per cell.
Of all the tagged proteins, approximately 99% of the copy-number distributions are well fit with the gamma distribution, which is described with two fitting parameters a and b (Figure 1B) (2). At low expression levels, a and b have clear physical interpretations as the transcription rate and protein burst size respectively. At high expression levels, the distributions are dominated by extrinsic noise.

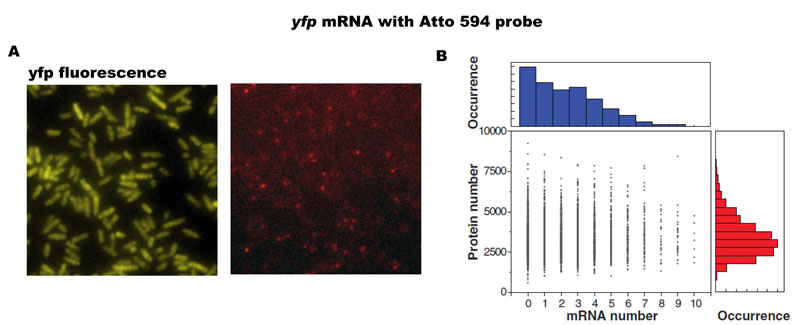
Figure 2: (A) (Left) Protein and (Right) mRNA from the TufA-YFP strain, in which TufA is tagged with YFP, are detected simultaneously in the same fixed cells. (B) (Top) mRNA and (Right) protein levels. Protein versus mRNA copy number plot for the TufA-YFP strain. Each point represents a single cell of the strain. The correlation coefficient is r = 0.01 +/-0.03 (mean +/- SD, n = 5447).
The simultaneous profiling of mRNA and protein revealed that the mRNA and protein copy numbers of a single cell for any given gene are uncorrelated (Figure 2); that is, a cell that has more mRNA molecules than average does not necessarily have more proteins. This perhaps counter-intuitive result can be explained by the fact that mRNA has a much shorter lifetime than protein in bacteria. A mammalian cell, by contrast, has comparable mRNA and protein lifetimes, and hence is expected to have more correlated mRNA and protein levels than a bacterial cell. Taken together, a quantitative and integral account of a single-cell gene expression profile is emerging.
References:
- Taniguchi, Y., Choi, P.J., Li, G.-W., Chen, H., Babu, M., Hearn, J., Emili, A., Xie, X.S. (2010), "Quantifying E. coli Proteome and Transcriptome with Single-Molecule Sensitivity in Single Cells", Science 329: 533-538
-
Friedman, N., Cai, L., Xie, X.S. (2006), "Linking Stochastic Dynamics to Population Distribution: An Analytical Framework of Gene Expression", Phys. Rev. Lett. 97: 168302
|
