The nucleus of a human diploid cell contains 46 chromosomes, 23 maternal and 23 paternal, together carrying 6 Gb of DNA, whose 3D structure is crucial for cellular functions. We used an improved chromatin conformation capture method and phased (haplotype-resolved) single-nucleotide polymorphisms (SNPs) to distinguish between the two haplotypes of each chromosome (Figure 1) and reconstructed the first 3D genomes from single diploid human and mouse cells. We term this method "diploid chromatin conformation capture" (Dip-C).
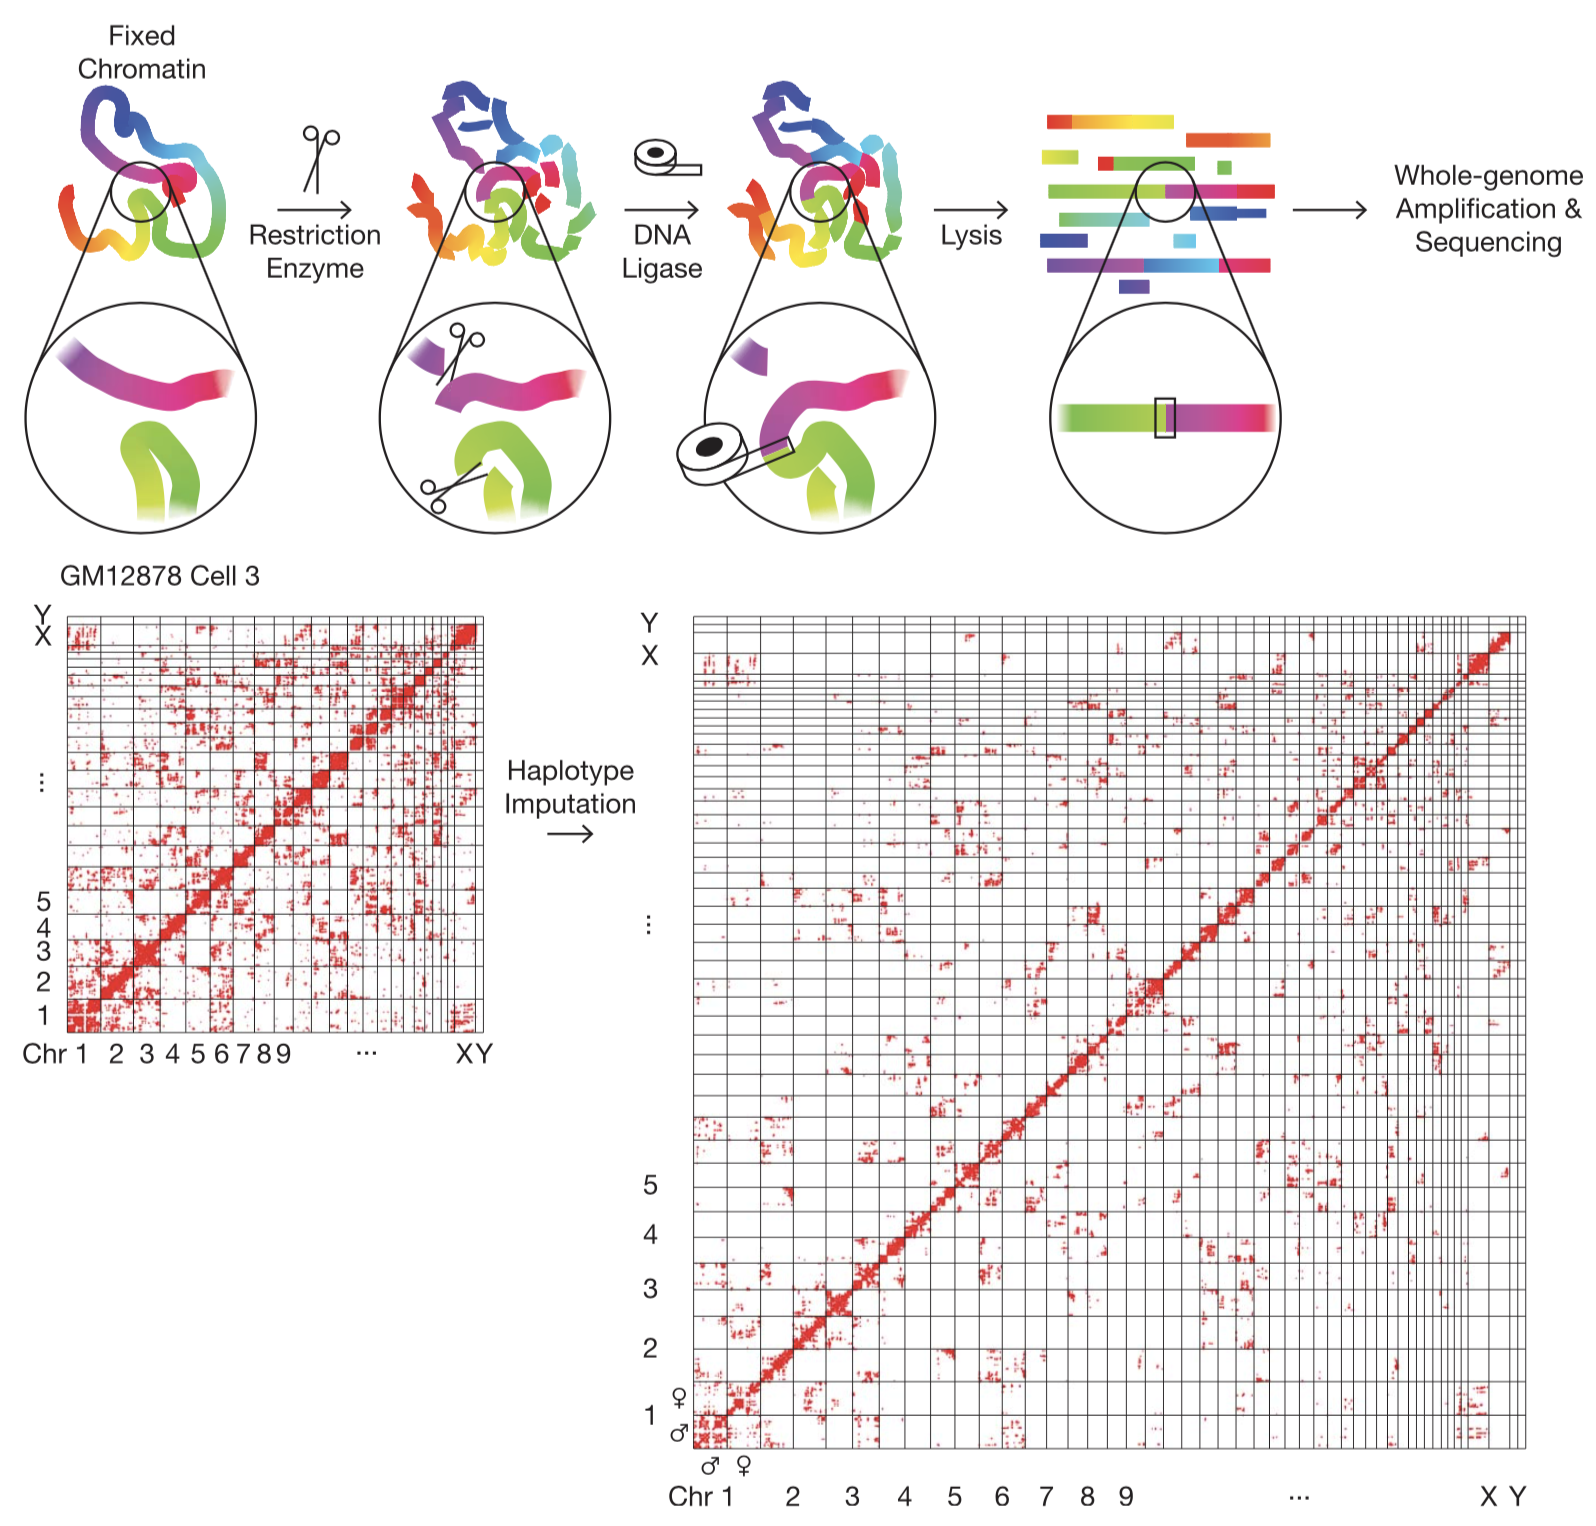
Fig. 1.
The Dip-C Method. (Top) Schematic of the chromatin conformation capture protocol. Colors represent genomic coordinates. (Bottom) Imputation of the two chromosome haplotypes linked by each chromatin “contact” (red dots).
We reconstructed the 3D diploid human genomes at 20-kb resolution (~100 nm) (Figure 2). We also used published data to reconstruct 3D diploid mouse genomes. Our Dip-C results provide a holistic view of the stochastic, fractal organization of chromatin across different genomic scales.
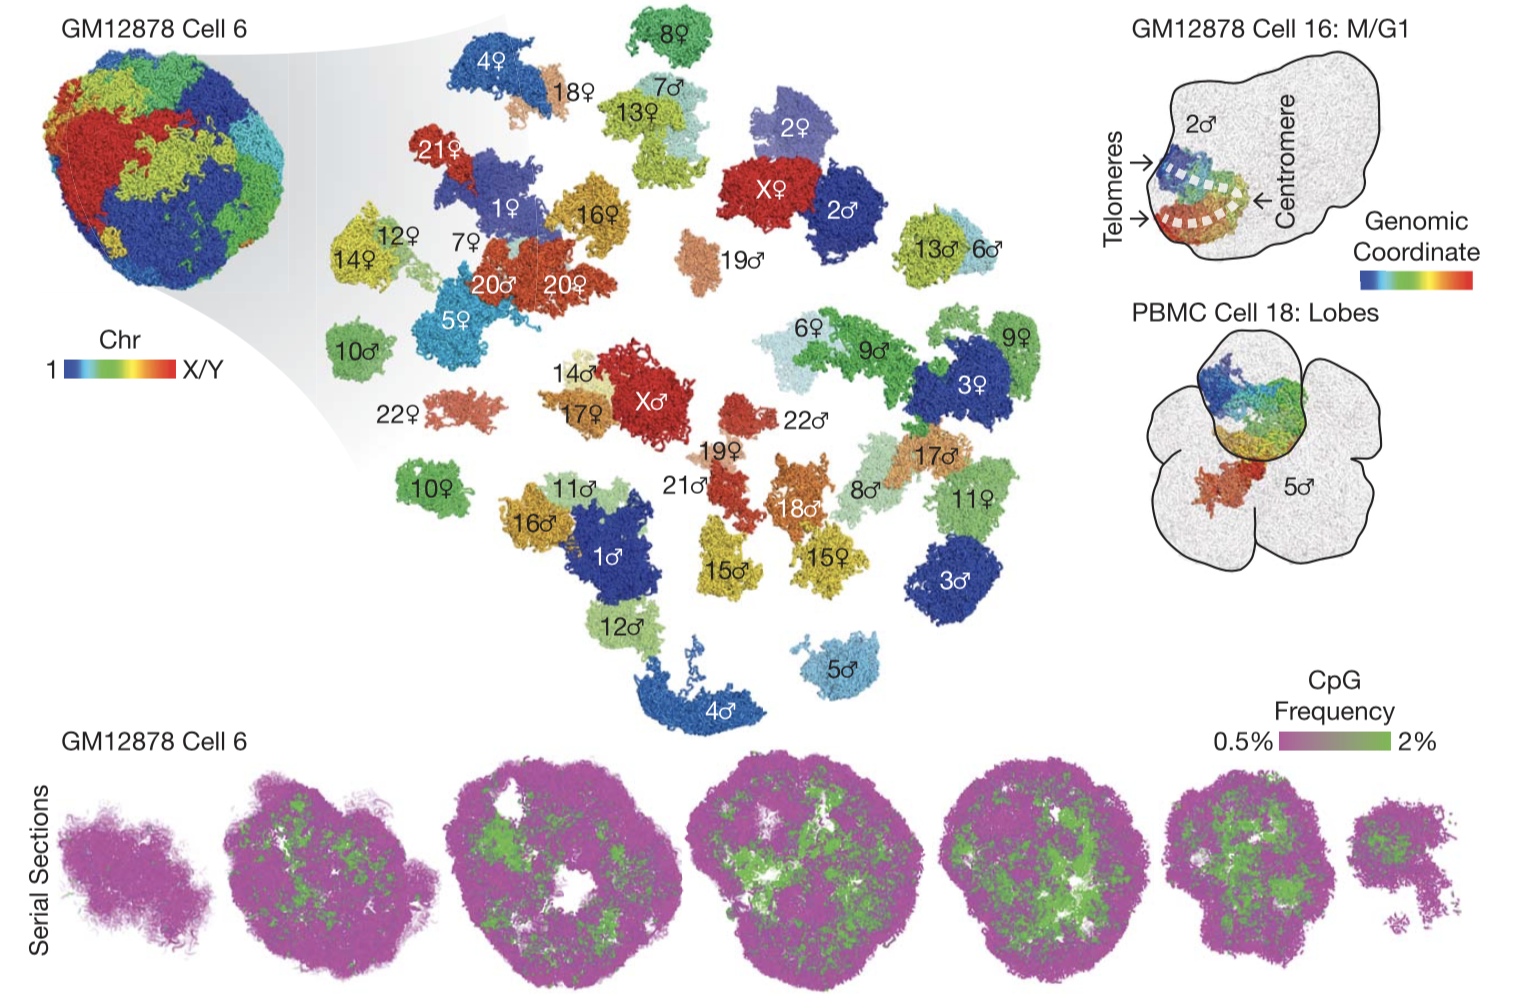
Fig. 2.
3D genome structures of single diploid human cells. (Top left) 3D genome structure of a representative cell. (Top right) Peculiar nuclear morphology in a cell that recently exited mitosis and in a cell with multiple nuclear lobes. (Bottom) Serial cross sections of a single cell showing compartmentalization of euchromatin (green) and heterochromatin (magenta), visualized by CpG frequency as a proxy.
We examined the structural relationship between the maternal and paternal alleles (Figure 3). Our data captured the structural difference between the two alleles caused by genomic imprinting and by X chromosome inactivation (XCI). We can also pinpoint genomic changes, such as SNPs and CNVs, to their precise spatial locations in the cell nucleus.
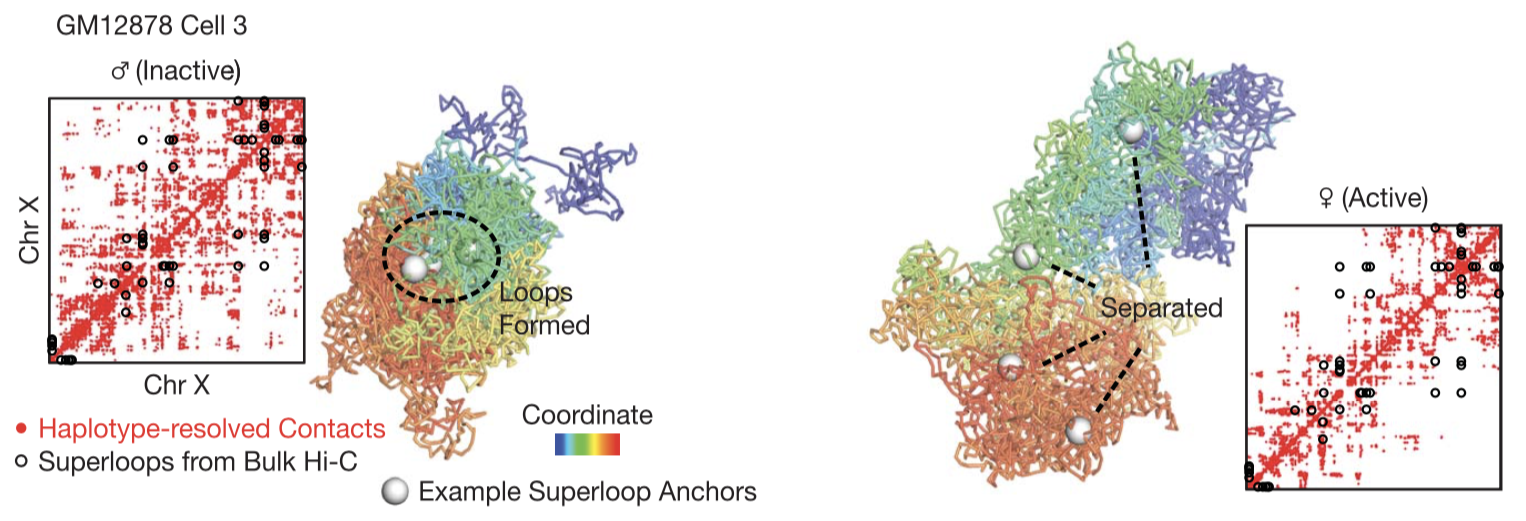
Fig. 3.
Distinct 3D structures of the two X chromosomes. Here we show haplotype-resolved contact maps (red dots) and 3D structures of the two X chromosomes in an example cell. Black circles denote "superloops". White spheres denote four example superloop anchors (DXZ4, x75, ICCE, and FIRRE).
We examined the cell type dependence of 3D genome structures (Figure 4). With Dip-C, we are in a position to carry out cell typing with genome structure as the sole variable. Given the high information content of 3D structures, many possible features might be used in cluster analysis. Here, we chose single-cell chromatin compartments as the input variable of PCA. The four cell type clusters were clearly separated, with one of the most differentially compartmentalized regions shown.
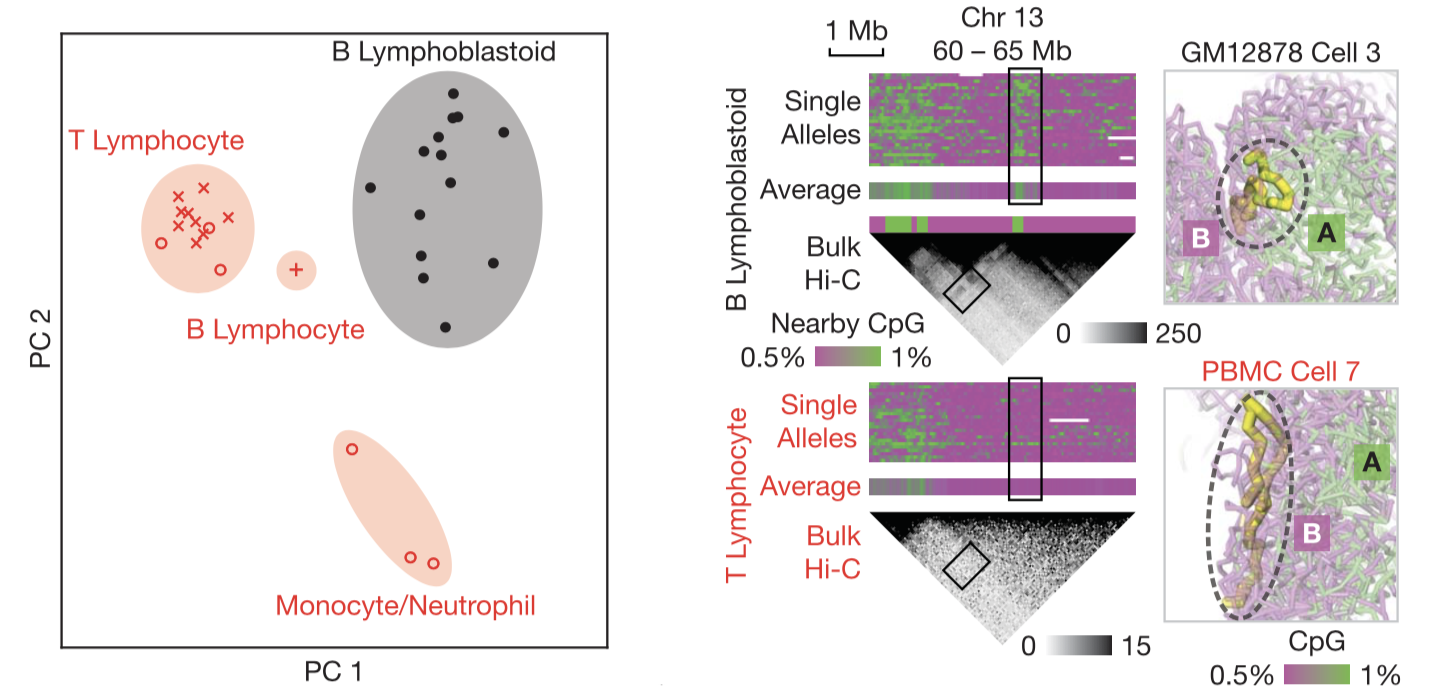
Fig. 4.
Cell type–specific chromatin structures. (Left) Four cell-type clusters can be distinguished by unsupervised clustering via PCA of single-cell chromatin compartments. (Right) An example region that was differentially compartmentalized between two cell types. Right panels visualize the configuration of the ~0.5-Mb region (thick yellow sticks) with respect to the rest of the genome (transparent, colored by CpG frequencies).
Our initial examination of only a handful of cell types has clearly shown the tissue dependence of 3D genome structures. A systematic survey of more cell types under various conditions will likely lead to new discoveries in cell differentiation, carcinogenesis, learning and memory, and aging.
References:
Tan, Longzhi; Xing, Dong; Chang, Chi-Han; Li, Heng; Xie, X. Sunney "Three-dimensional genome structures of single diploid human cells," Science 43, 924-928. DOI:10.1126/science.aat5641 (2018)
|

